Asking for wood flour at a particular mesh grade does not always define the finished product completely. One sieve label or median diameter cannot show how much fine material is present, how much coarse material remains, or how broad the distribution is.
Key answer: Wood flour particle size distribution describes the proportions of particles across sizes. Two batches can have the same D50 and different fine and coarse tails. Sieve mass distributions, laser volume distributions and image-based number distributions are not interchangeable. Agree on the method and basis before comparing batches or changing the process.
Contents
What does a single mesh label or D50 leave out?
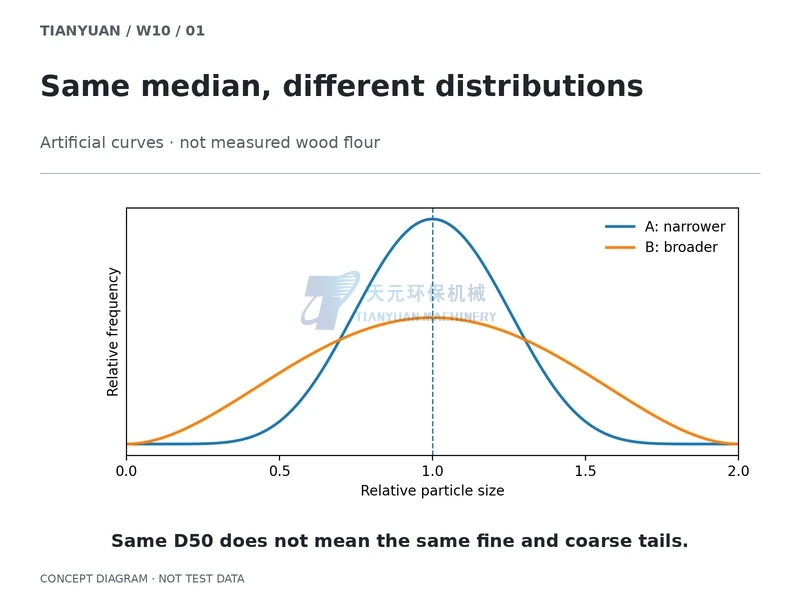
A narrow distribution and a broader distribution can share the same median. The broader one may contain more material at both ends. This is a statistical possibility, not a Tianyuan test result; the first illustration uses artificial mathematical curves on a relative-size axis.
In a purchase specification, state what a mesh designation actually requires: the sieve system, physical opening, proportion passing or retained, and procedure. A label alone does not distinguish a permitted oversize fraction from a requirement for complete passage, and it does not describe all sizes within the passing fraction. See the separate mesh and micron explanation.
As a practical review rule, connect the full report to the intended use instead of comparing only a headline D50. When batch performance changes, check both tails before deciding whether feedstock, separation or measurement conditions have changed.
Read Dv10, Dv50 and Dv90 on the correct basis
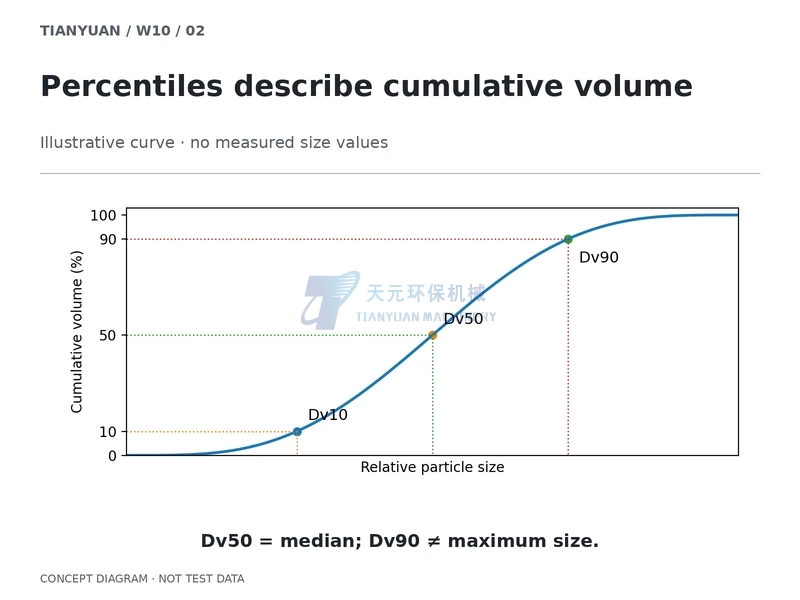
For a cumulative undersize distribution weighted by volume, Dv10, Dv50 and Dv90 mark the sizes below which 10%, 50% and 90% of particle volume lie. Dv50 is a volume median, not an arithmetic mean. Dv90 is not the maximum size. Particle-size statistics guidance explains these percentile conventions.
The remaining volume above Dv90 is not eliminated by reporting that percentile. A customer who needs an upper-size restriction should define the relevant coarse fraction and measurement procedure separately rather than assume that Dv90 is an absolute cut-off.
Keep the weighting basis visible. A number distribution counts each particle; a volume distribution gives larger particles more weight. Treating mass and volume fractions as equivalent requires suitable assumptions about density. Do not silently apply that equivalence to a mixture containing different wood components or foreign material.
When a report only says D10/D50/D90, request the method, units and weighting basis before comparing it with another report. Identical numerical values from different methods do not prove identical powder.
Sieving, laser diffraction and imaging answer different questions
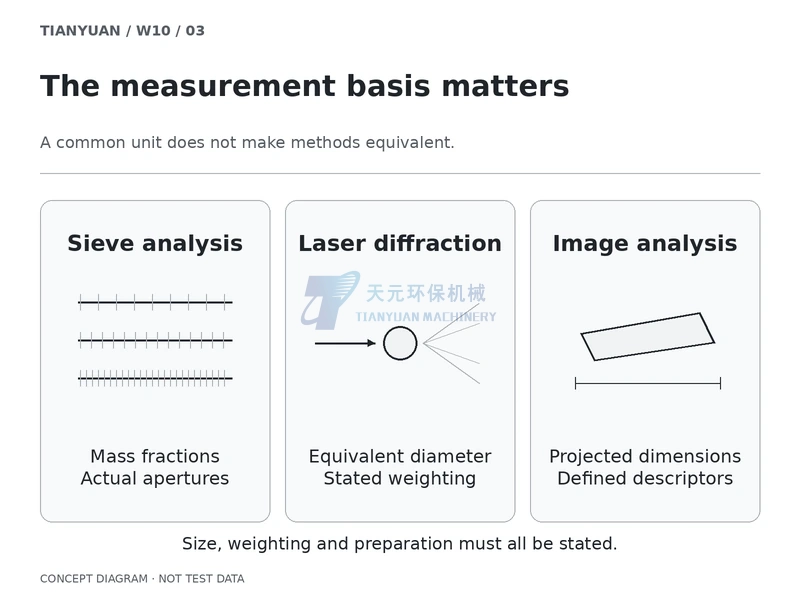
| Method | Reported quantity to define | Important comparison limit |
|---|---|---|
| Sieve analysis | Mass passing or retained at actual apertures | Procedure and particle orientation affect passage. |
| Laser diffraction | Equivalent-diameter distribution on the stated basis | The optical model and dispersion are part of the result. |
| Image analysis | Defined projected dimensions and weighting | Length, width and equivalent diameter are different descriptors. |
A common unit such as micrometers does not make results interchangeable. Measurement-method guidance distinguishes the techniques, while RETSCH’s sieve guidance highlights orientation effects for elongated particles. For wood flour, passing an opening does not establish every particle’s maximum length.
Keep the laboratory acceptance method separate from the production operation. A screen or air classifier separates material; the agreed measurement procedure describes the resulting product. A disagreement between reports should first trigger a method check, not an automatic accusation of equipment failure.
Connect the distribution to the use—not to “finer is better”
The USDA-hosted Wood Flour chapter discusses material specifications in relation to applications. It does not establish a universal distribution for every end use. A practical specification should identify which features matter to the customer and how they will be checked.
For a project, validate relevant outcomes separately: consistent feeding, unacceptable coarse pieces, excessive fines, and performance in the actual formulation or finished product. Neither a narrower distribution nor a smaller median automatically guarantees improvement in every property.
Further milling also needs an economic check. A published two-stage wood-grinding study connects fineness and energy under its tested conditions; it is not a Tianyuan performance curve. Compare accepted product output and an explicitly defined energy basis rather than pursuing a small number at any cost.
A size percentile is also not a dust-safety certificate. Assess the actual material and process hazards separately, using appropriate professional review and wood-dust fire and explosion guidance. No universal safe particle-size threshold is proposed here.
Make batch comparisons repeatable and traceable
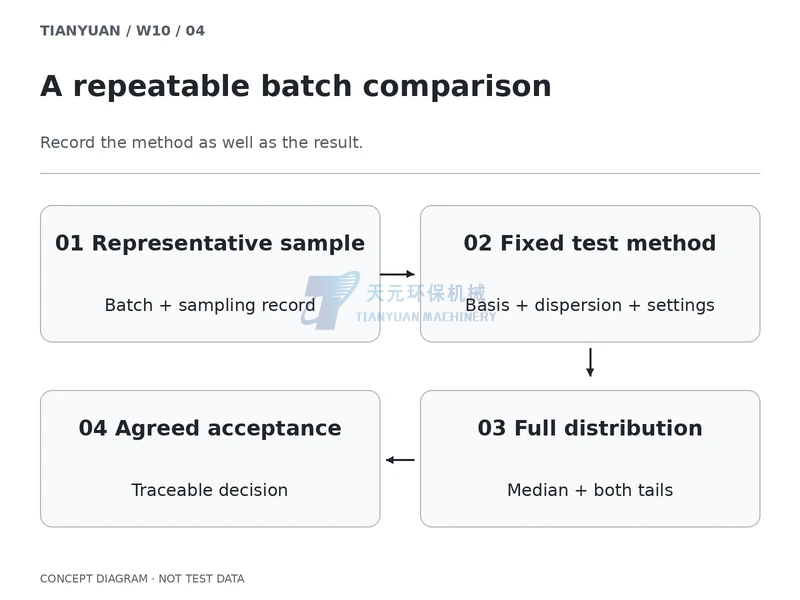
The following record is a proposed quality-control framework, not a new mandatory test standard. Define the batch and sampling scope first. Do not assume that a selected pinch from the top of a bag represents the whole lot; agree on sampling and subdivision appropriate to the product.
- Material source, batch identity and sampling locations.
- Sample subdivision, moisture basis and any conditioning.
- Measurement method, apertures or instrument settings, and dispersion procedure.
- Mass, volume or number basis, units, full distribution and agreed summary indicators.
- Acceptance decision, exceptions and traceable records of any method change.
State whether preparation is intended to disperse agglomerates or to characterize the material in its delivered state. Do not change dispersion silently to produce a more attractive result. Recheck comparable test conditions before interpreting a shifted curve as a production change.
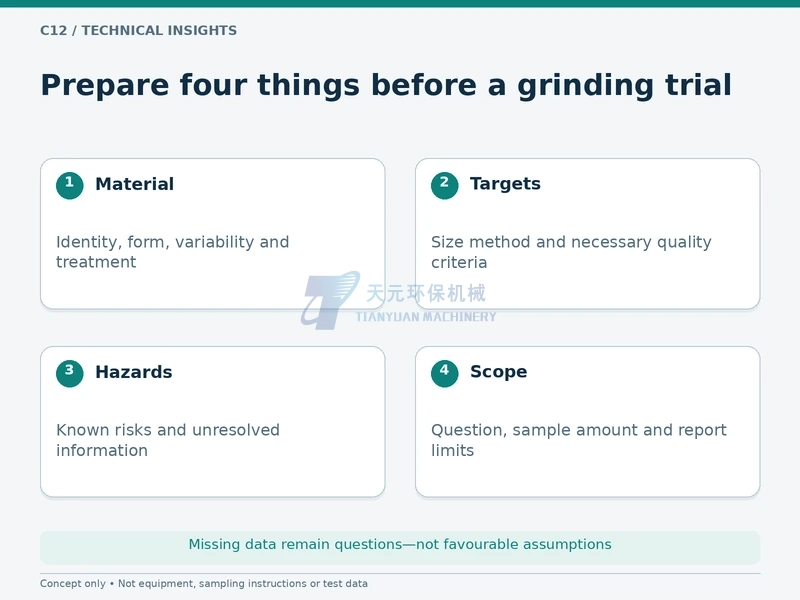
The grinding-test preparation checklist can help define the target before a new trial. Keep the underlying method and batch records, not only a screenshot of the curve. Sampling quantities, tolerances and test frequencies must be agreed for the application rather than invented as universal numbers.
A Tianyuan fineness range is not a distribution guarantee
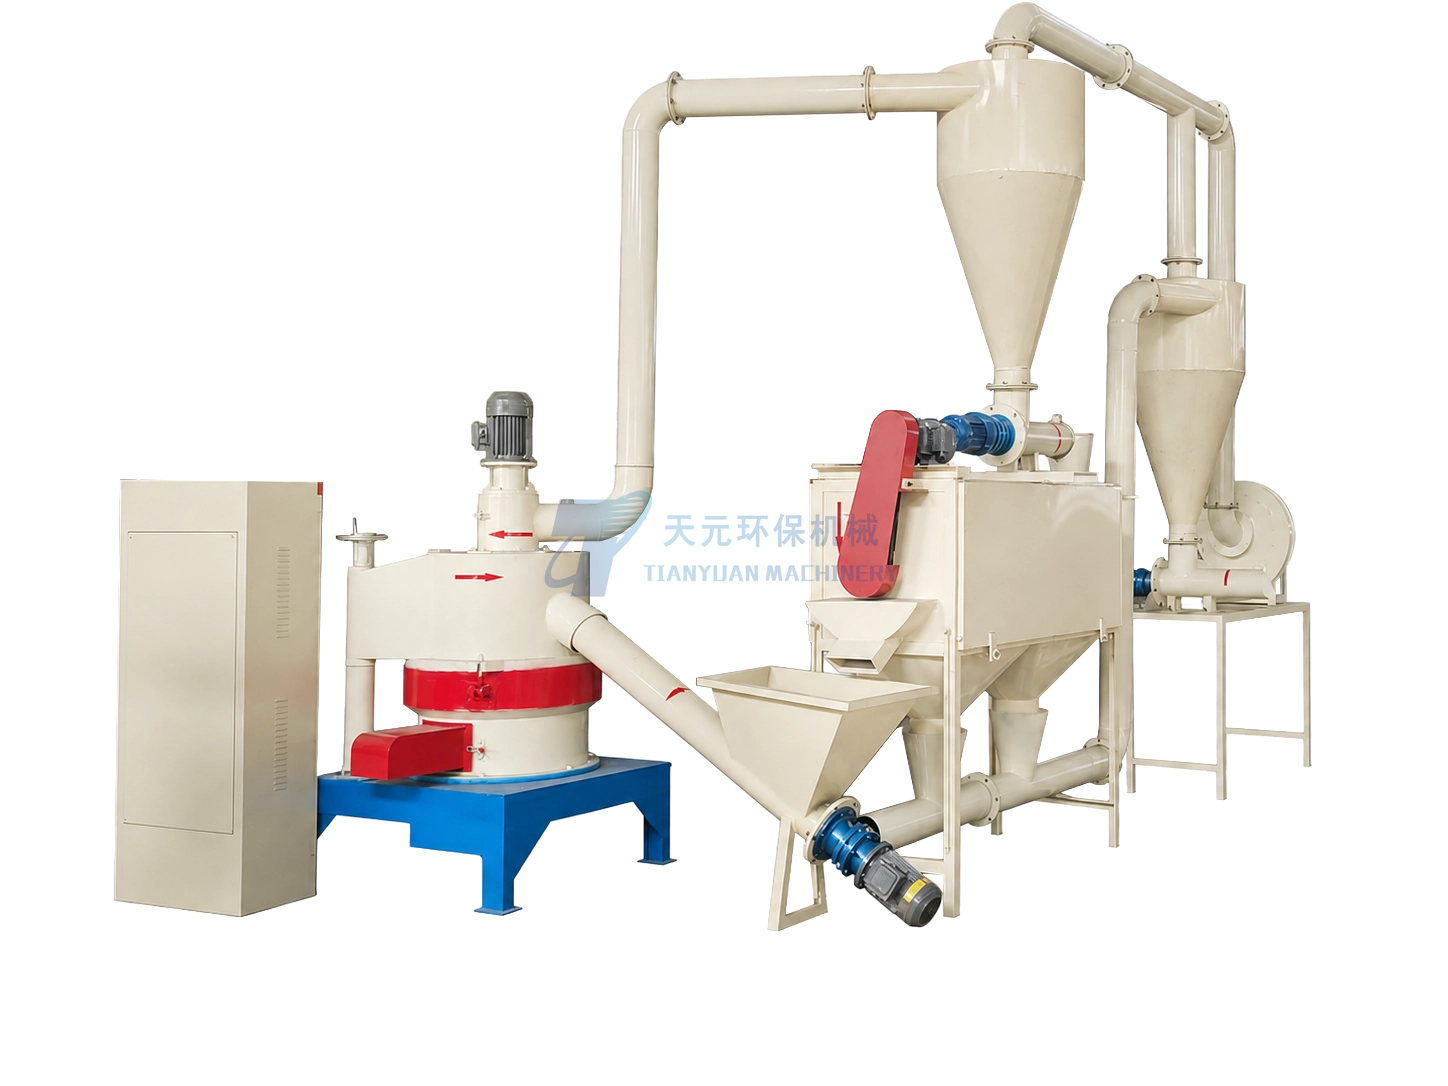
The confirmed TYMF6R-600 range is 30–325 mesh, 100–500 kg/h and a maximum feed diameter of 5 mm. It is a downstream fine mill for prepared woody or plant-fiber material, not a log crusher. These values do not automatically specify a Dv50/Dv90, guarantee every particle passes a chosen test, or promise maximum throughput at maximum fineness.
Agree separately on the target measurement method, acceptable distribution, any necessary shape or moisture requirements, and accepted product output. Actual capacity depends on material, feed condition, target fineness and site conditions. Do not transfer this model’s figures to other mills or auxiliary equipment.
Ordinary extraction and grounding do not replace a complete material-specific fire and explosion prevention and protection design. Product-size acceptance and dust safety are related topics, but they are not the same approval.
FAQ
Does the same D50 mean two batches are the same grade?
Not by itself. Compare the tails, measurement basis and the other agreed product requirements.
Can Dv90 be used as the maximum particle size?
No. Approximately 10% of the particle volume lies above that percentile. It is not the maximum.
Do different sieve and laser results prove that an instrument is faulty?
No. The methods and their statistical bases differ. Particle shape and dispersion conditions also need to be checked.
Is a narrower or finer distribution always better?
No. The useful specification depends on the end use, processing stability, accepted output and energy requirements.
Can a small selected pinch represent an entire batch?
That cannot be assumed. Define the batch and an appropriate sampling and subdivision procedure before testing.
Conclusion
Wood flour control needs to answer how much material exists at each size, not merely quote a mesh label or median. Compare full distributions using defined methods, weighting bases and representative samples, then connect the results to the end use and accepted output. This prevents method differences from being mistaken for machine problems.